Category Archives: Python

Re-learning English: Pluralization and Lemmatization

Links to code on Github: the singularizer and pluralizer, and the lemmatizer


Executive Summary:

I created a word lemmatizer in R and Python that automatically “digests” words down to their core form for the purpose of dimensionality reduction for NLP (Natural Language Processing) tasks. The lemmatizer works by recognizing formulaic endings to English words, yet handle enough special cases that they outperform stemmers such as Porter and Snowball in accuracy. Because this lemmatizer relies on structured word endings, it is less dependent on external dictionaries than most lemmatizers such as WordNet, and as such, it performs nearly equally as well on real or invented words that do not appear in dictionaries (unlike WordNet).


Motivations:

My motivations starting this project were simple: dig my hands deeper into NLP (Natural Language Processing) and develop useful code for myself where other code wouldn’t (or wouldn’t quickly) work. What started as a quick exploratory fix on my Wikipedia Spark project then turned into a substantial sub-project that carefully handles English words; I will focus on the final product here.


There are two main camps for dimensionality reduction in the NLP word: stemming and lemmatization. Stemmers (usually) simply chop off endings in an attempt to eliminate relatively meaningless differences in phonology (e.g. does the analysis really depend on whether he walks or I walk? The key idea is walk in both cases). While useful for their speed and simplicity, they suffer from an overly simplistic approach to manipulating words that results in many disconnected similar words (e.g., multiply and multiplication stem to similar but distinct terms, a type II error of sorts) as well as many spuriously connected words (e.g. universal, university, and the made-up word universion all stem to univers, a type I error of sorts). Lemmatizers, on the other hand, seek to capture the “lemma” or core/root of a word by looking through relationships in dictionaries. With lemmatizers, phonologically difficult relationships like that between better and good are accurately captured, so they’re very useful when accuracy is needed (especially for reduction of type I errors/overstemming). However, with a lemmatizer, one often has to put in extra under-the-hood work to link together related words of different parts of speech, first detecting the part of speech (with error) and then traversing the web of derivationally related forms (and synsets and pertainyms, etc.) until one decides on a “root” form. Furthermore, words not captured by the dictionary can’t be handled properly, which is a more common problem than one would expect. For instance, what’s the relationship between carmaker and carmaking? WordNet, one of the most powerful and popular lemmatizers (used by the popular NLTK package), doesn’t know, as carmaking isn’t defined. Undefined words can be accurately processed by stemmers (the carmaking example is, for example) but pose a real problem for many lemmatizers. Clearly there is a middle ground between the overly general world of stemming and overly specific world of lemmatizing, so I set out to create a program that would find it.


English as a language is characterized by its decentralization and archaic spelling as well as its repeated (though occasionally inconsistent) use of patterns to generate inflectional forms. This fact requires a mix of dynamic/rule-based approaches (to generalize the inflectional system) as well as static/case-based approaches (to successfully handle legacy spellings and manage the confusing mixture of Latin, Greek, French, and Anglo-Saxon morphology that characterize English words).


So, I created the “word digester” to combine the best aspects of stemmers (simplicity/ease of use; usefulness on words left out of the dictionary) with the best aspects of lemmatizers (comprehensiveness; handling of special cases; readability of outputs). It will take any English-like word (newly invented or well-established) and digest it into its core form. It handles enough special cases to be useful on some of the more peculiar English word forms, yet it uses enough general rules to be useful without relying on a dictionary. It’s not prohibitively slow either (digesting a 20k-word dictionary in roughly 1-3 seconds in both R and Python). Admittedly, as a recent personal project of definite complexity, there are still plenty of gaps in its coverage of special cases, which can be fixed in time. Below I’ll highlight a few examples that highlight the capabilities of the word digester and also discuss the singularizer and pluralizer functions I created as a companion project to the digester.


The (real or invented) words multiple, multiples, multiply, multiplied, multiplies, multiplier, multipliers, multiplying, multiplication, multiplications, multiplicative, multiplicatives, multiplicativelymultiplicativitymultiplicativeness, multiplicationment, multiplicativement, antimultiplicative, unmultiplicative, nonmultiplicative, dismultiplicative, multiplicate, multiplicating, and potentially more all reduce to multiple.


It handles some of the most relevant Latinate or Greek plurals as well: symposia and symposiums both reduce to symposium, and lemmata and lemmas both reduce to lemma, for instance, and the pluralize function allows selective creation of either plural form in the reverse direction. In addition, hypotheses reduces to hypothesis, matrices to matrix, series to series, spectra to spectrum, phenomena to phenomenon, alumni to alumnus, and so on.


Anglo-Saxon-style forms are also covered: berries reduces to berry, cookies to cookie, leaves to leaf, children to child, oxen to ox, elder to old, (wo)men to (wo)man, people to person, brethren to brother, and so on.


Many irregular changes are covered: pronunciation reduces to pronounce, exemplify to example, redemption to redeem, tabular to table, operable (and the made-up but more regular-looking operatable) to operate, despicable to despise, grieve to grief, conception to conceive, flammable to flame, statuesque to statue, wholly to whole, shrubbery to shrub, and so on.


Sensible words outside the dictionary are also properly handled: both buttery as well as butterific reduce to butter, and planning as well as the E.U.-favored planification both reduce to plan. Feel free to make up your own words and try them; currently only some rules are sufficiently generalized, so while antidisestablishmentarianismesquely reduces to establish, I can’t promise that every made-up word will be processed correctly.


I’ve verified, semi-manually, the digester’s results on a few corpora: a 1k-word corpus, a 20k-word corpus, and a 370k-word corpus. No errors were made with the 1k corpus; nearly all of the 1200 or so purported errors (defined here as digested word results that do not also appear in the same source corpus) made on the 20k corpus are either—from most common to least common—errors on proper nouns (expressly not intended to be handled by the function as other methods exist for that purpose), real words that do not appear in that corpus (not an error), or genuine errors that I haven’t bothered to fix yet (estimated on the order of 10 or so). This implies a true error rate of around 1% or less on the 20k-word corpus. I have skimmed through the purported errors on the 370k-word corpus (~47k of them), and have similarly found that most of the purported errors either are on proper nouns, are not real errors at all, or are on exceptionally rare, esoteric, often medicinal or taxonomical words (as these make up most of the 370k-word corpus to begin with as a consequence of the Zipf distribution of word frequency).


How does it work? Take a peek at the code on Github to see for yourself—though it is long, it is well-commented and fairly self-explanatory. The basic process involves handling each of the many recognized suffixes in the order in which they almost universally appear in words. Special cases are handled before the best-guess set of general rules handle the suffixes. Masks are used to hide words that have suffix-like endings that should not be removed. One of the most difficult aspects of making the digester as accurate as possible was designing an effective regex test to determine whether an ultimate “e” should remain attached to a word after suffix removal. The suffixes are handled in groups, in which only relevant subsets of words (those that end with something that looks like the suffix in question) are handled for efficiency. Writing some aspects of this code in C would certainly greatly speed up computation, but there isn’t any need for that on most scales as is, as I’ve designed the code such that it does not scale directly with the size or length of the input, but rather with the cardinality of the input (i.e. it handles each unique word only once).


The order I’ve used for processing is:

  • singularize plural forms
  • remove contractions
  • fix irregular common words (all as special cases)
  • remove certain prefixes (with a mask to prevent similar non-prefix forms from being removed)
  • remove adverbial ly suffix
  • remove noun-form ness and ity suffixes
  • remove adjectival esque and ish suffixes
  • remove adjectival able and ible suffixes
  • remove noun-form hood suffix
  • edit miscellaneous Saxon- and French-style suffixes
  • remove istic, ist, and ism suffixes
  • remove adjectival al, ial, ical, ual, and inal suffixes
  • remove adjectival ian suffix
  • remove adjectival ary suffix
  • remove noun-form ment suffix
  • remove adjectival ic suffix
  • remove adjectival ous suffix
  • remove adjectival ful and less suffixes
  • remove adjectival ar and iar suffixes
  • edit noun-form ance and ence suffixes
  • remove adjectival ant and ent suffixes
  • remove adjectival ive suffix
  • remove noun-form age suffix
  • remove noun-form tion and ion suffixes
  • remove noun-form ery suffix
  • remove adjectival y suffix
  • remove noun-form itude suffix
  • edit noun-form ysis suffix
  • remove comparative and doer-form er suffix
  • remove superlative est suffix
  • remove verb-form ed suffix
  • remove verb-form ing suffix
  • remove verb-form ify suffix
  • remove verb-form ize suffix
  • remove verb-form ate suffix
  • fix miscellaneous verb forms to similar noun forms (e.g, multiply to multiple)
 

Re-Learning English multiple.png

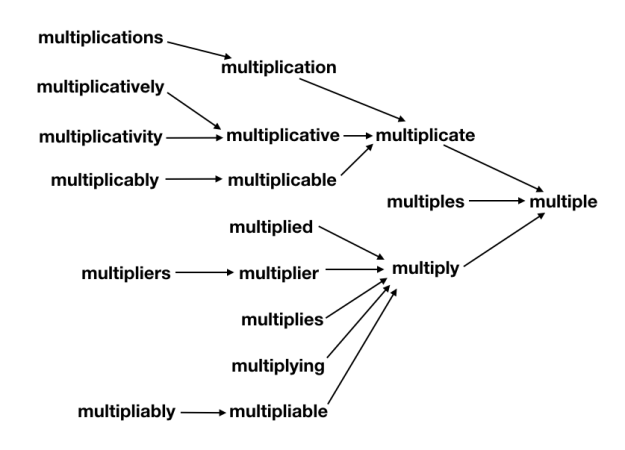
What’s important to note is that each step along the way, the suffixes are removed such that a valid word is produced. In this way, the transformation pipeline functions such that it “collects” different derivationally related forms on their way toward the base form, analogously to how a river’s tributary system works. As such, any failure of the system to properly join one subset of derivationally related forms into further pathways toward the base form will leave that subset as a single valid (albeit not completely basal) word instead of creating something new and unrecognizable. Additionally, this design makes debugging and adding extra special cases easy, as each special case only need be handled once in order for all its derivationally related forms to also be successfully processed. Similarly, it’s straight-forward to force the system to not join together some branches if desired––the change need only be made in one place.


Coda:

I initially coded up these functions in R, though wanting to expose it to wider use, especially within the NLP universe (which is very Python-centric), I transcribed the code into Python with the help of an R-to-Python transcription program I wrote myself. To learn more about that process, see this post.

Transcribing R to idiomatic Python: Code that Edits Code

Links to code on Github: code transcriber and resulting Python code


Executive Summary:

I wrote code that transcribes my (native) R lemmatizer into Python for wider use. As the lemmatizer performs the same few basic operations many times, I was able to teach the transcriber how to transcribe each type of statement into idiomatic (Pythonic) Python, making it usable, readable, and efficient in both languages. In this way I’ve halved my need to update and debug code, saving myself much time and many headaches.


Motivations:

After developing my lemmatizer in R, I wanted to use it in conjunction with other NLP packages in Python. Keeping in mind that I’d often make small changes in my lemmatizer code in R, I wanted some way to easily and safely both generate and maintain the Python cousin of the same set of code. Working on code in multiple languages is a part of many team projects, and I wanted to get into the habit of never duplicating myself, as writing the same programing idea in two languages from scratch is a waste of resources.


The idea is simple to conceive but (as I found) somewhat difficult to thoroughly execute, especially defensively to unforeseen changes. Some language aspects (R’s use of brackets and default two-space indentation vs Python’s use of colons and four-space indentation) are relatively straight-forward to fix with a few well-tuned regular expressions (regex). Other aspects are much more difficult to properly handle: among these are Python’s basis on lists vs R’s basis on vectors, handling missingness across two languages that differ widely in how missingness is encoded, translating carefully-tuned string operations into Pythonic Python (both for the sake of readability and performance), and transcribing statements written over more than one line. I’ll address these in order below.


Python’s lists allow a kind of freedom that R’s vectors don’t have, such as handling multiple data types and also allowing nesting (similar to R’s lists in these respects). The better analogue to R’s vectors in Python is numpy’s arrays, and I naturally made extensive use of these for efficient vectorized calculations on input words. However, for convenience to the user (including myself) I forced myself to accept the most common structure as input, which for Python is still the list, handled with one simple customized list comprehension ensuring type safety and flatness. R makes extensive use of its combine c() method for creating vectors, which has the unique property of ensuring flatness. I had to use a few other customized bits of code to ensure flatness after some of the vector combinations I had written in R.


Numpy strings do not natively support missingness. Wherein my R code made use of boolean missingness to denote values neither true nor false (e.g., some words like sheep are neither plural nor singular), I had to work around this by simply considering things singular if they do not need to be made singular for the lemmatizer to work. It would be possible to keep a separate boolean numpy array for missingness, but that seemed excessive when a simple solution such as the above worked fine (after all, the complicated solution would not be very Pythonic).


Translating idiomatic R (such as that with extensive use of infix operators) into idiomatic Python (list comprehensions, tuples, and such) required a more fine-tuned approach, and such transcriptions needed to be baked into the transcriber due to their extensive use. I translated most of R’s paste() statements into list comprehensions with simple string concatenation. I found that while Python strings conveniently support using a tuple as the argument in the endswith() method (to check if the string ends with multiple endings), numpy.chararray only supports single strings (and numpy.ndarray does not support the endswith() method at all), also necessitating the creation of more list comprehensions. I had to take many things into account when moving arguments around (e.g. from either infix operator position in R to the object-like position in Python), including parentheses, operators and their order of operations, and non-coding character strings (either in literal, quoted strings or comments).


Additionally, I taught the transcriber how to evaluate arguments on separate lines to handle my longer, complicated vectorized logical computations. Adding the trailing backspace for Python was easy; identifying whole argument chunks and moving them around appropriately was not.


After running the code transcriber, the output Python code only requires a handful of manual changes—which can be copy-pasted identically each time as they are the most fundamental and language-dependent processes and least likely to change—to function identically to its R counterpart.


Future developments could further reduce the need for the remaining few manual changes, though some are likely infeasible (or prohibitively burdensome) to handle in Python (e.g. non-standard evaluation, which is very idiomatic and unique to R). The pluralization functions are readily transcribable as well once I remove their dependency on non-standard evaluation, which is a convenient but not essential aspect of their function in R. I’d also like to further improve the readability of the code in ways that don’t significantly impact performance, and plan to explore subclassing numpy.chararray to clear up some boilerplate verbiage among the methods (especially when it comes to testing element-wise if a string matches any of a few targets).

An Basic Approach to Reinforcement Learning

Executive Summary:

Despite my lack of expertise with the topic, I used this approach to win 3rd place at a Trivago hackathon in NYC on November 11, 2017. The task was to improve Trivago in some way (an incredibly open objective), and most teams, including the one I pitched at led, focused on improving Trivago’s web portal and search listings to help grow Trivago’s market share. My idea was roughly to apply a basic reinforcement learning approach to change the static (non-learning) search result ranking algorithm into one that continuously improves its market segmentation based on user interaction with the site. My proposed algorithm ranks search results according to what has worked the best with demographically similar visitors in the past, along with enough randomness to continue learning (i.e. not get stuck in a local minimum). The Trivago judges mentioned that the general idea is one they’re already developing and that they liked my specific approach, which was a bit different than what they had considered thus far.


Motivations:

It is sensible to assume that everyone prefers better-rated hotels at better prices, but I’d expect some customer segments to be more price-sensitive than others. (Some people will always book the cheapest option; some will always book their favorite regardless of price; and some will carefully deliberate.) I think it’s also sensible to assume that this behavior will, to some extent, track with demographic information such as income. And further, since IP is a proxy for location, and location is a proxy for demographic information like income, Trivago and other similar companies should be able to use such information when ranking listings for users.


I created a multi-dimensional space (numpy’s ndarray being the natural choice) that keeps track of how price-sensitive and discount-sensitive demographic segments are: one dimension for income segments (log transformed), one dimension for age segments, and one dimension as a proof-of-concept placeholder for other segments like gender. A final dimension just divides the space up into price-sensitivity information and discount-sensitivity information, though I conceptualize it as a three- (or n-) dimensional space pointing to a two- (or m-) element vector. Such a system does not rely on particular values of m and n, which can be chosen based on what provides the most useful information (n being the number of demographic information types that are useful, and m being the number of sensitivity-to-hotel-aspect features that are useful). I’ll call this the “demographic preference space”.


I initialize a few parameters, such as the learning rate, the level of randomness, and a set of effect-size parameters that influence how much different types of actions (from greatest to least: creating an account, purchasing through express checkout, clicking on a hotel, or leaving without purchasing anything) affect the demographic preference space. While making a hotel purchase does directly indicate a user liking a particular hotel, there’s unfortunately no direct measure of a user’s dislike of a particular hotel, so I set the effect-size for leaving without purchasing anything as negative to “blame” all the hotels presented to the user a little bit for not being what the user wanted.


Each interaction changes the demographic preference space based on the learning rate and the effect size. When deciding which hotel listings to present to a new user, each hotel that corresponds to their searched terms gets scored based on how that hotel scores along each hotel aspect (price and discount) compared with the assumed preferences of the user based on the demographic preference space. In more detail, a local Gaussian average of price-sensitivity and discount-sensitivity are taken in the demographic preference space, centered at the user’s own demographic position. These sensitivities are passed through a hyperbolic tangent (tanh) function to provide reasonable bounds on their amplitudes. Each sensitivity (for instance, price-sensitivity) is multiplied against its relevant score from the hotel (for instance, price-score), and each of these terms is summed for a total score for the hotel for the user. As I also scaled hotel aspect scores (price scores and discount scores) from +1 to -1, low discount-sensitivity (-1) against low discount (-1) registers as a match, just as high discount-sensitivity (1) against high discount (1). A (relatively small, adjustable) random number is added to the score for each hotel to prevent the algorithm from getting stuck in a local minimum, and the hotels are sorted by score and displayed to the user accordingly.


The main proof of concept was showing that despite initial rankings being random, wealthier and less wealthy phantom users applying their preferences (toward nicer hotels and toward cheaper hotels, respectively) quickly (within a few hundred interactions) resulted in wealthier users being shown accordingly nice hotels and less wealthy users being shown accordingly cheaper hotels.


One major challenge of this competition was the lack of any user or hotel data, which I had to write functions to generate for this proof of concept. That, combined with the competition’s duration of only one day, prevented any more sophisticated approaches, though I had thought of a few. The algorithm as I submitted it does not make any outright assumptions about hotel preferability, instead just following what the users pick. Perhaps a hybrid approach could improve results. There were also plenty of other hotel aspects, most notably rating (and users’ sensitivities to these hotel aspects, e.g. rating-sensitivity), that could have easily been included in the demographic preference space. And despite using some nuts and bolts of neural networks (such as the idea of a learning rate, vaguely convolution-like processing of the demographic preference space, incrementation of weights based on fit/error assessment, and use of functions like tanh to prevent “blowing-up activation”), there was no neural network component to my solution despite being well-suited for such an approach. Had we more time, I would have pursued such low-hanging fruit as next steps.

Hidden in Plain Sight: Scraping Amazon Price History Data from Images on the Web

Executive Summary:

Where previous bootcamp students had tried and failed to scrape Amazon for price history data, I succeeded—not by being smarter, but by taking a more creative approach. I instead scraped a third party site that tracks Amazon—CamelCamelCamel—and recreated Amazon price data by analyzing graph images displayed on the site. I didn’t actually scrape Amazon, but I successfully obtained the same data (within a fraction of a percent rounding error) by cross-applying my skills in image analysis in a different domain.


Motivations:

Amazon price data is freely available through the Amazon API, limited at a generous 1 million API calls per month. As a competitor or consumer on the marketplace, price history data are extremely useful and can drive much wiser decisions about when and what to buy and at what price. But seeing the current prices (that’s all they provide) only gives a fraction of the total picture: how do the current prices compare with prices from the recent past? When deciding to purchase or sell a stock or trade in foreign currencies, one would naturally want to look at the price or exchange history. Analogously, what about Amazon price history data? Such historical pricing data were apparently available directly through an Amazon service in the past, but today Amazon does not provide such a service and does not make it possible to scrape such data directly from the Amazon web system, leaving consumers and retailers to search for this information elsewhere. As these price history data are quite valuable, websites do exist that provide access to such information; among these are CamelCamelCamel and Tracktor. (Terapeak allows pinging price history for Amazon items, but at a paltry 500 API calls per month.) These websites make the data available in graphical form only, perfect for letting consumers and retailers quickly and qualitatively improve their decisions to buy or sell at optimal times. By not directly providing the underlying data themselves, these websites protect their business model of providing access to difficult-to-come-by information. This has the side effect of preventing more quantitative analysis on the pricing data, which would also be of great utility to sophisticated, data-minded business in very competitive markets. I set out to obtain such a rich data set as a proof of concept of the following web scraping approach, which combines traditional web scraping using sophisticated tools like the Selenium webdriver along with rudimentary image analysis. I top off the proof of concept with a brief quantitative analysis of the data set itself—as an example of how a business might use such data—in the findings section.


Between the two more prominent choices of Amazon price trackers, I chose to use CamelCamelCamel, as it tracks vastly more items than Tracktor and records more information on each item than Tracktor. The CamelCamelCamel site (according to their robots.txt file) does not prohibit scraping, though they have made the barrier for scraping the data quite high (it is their business model, so there’s good reason to protect it). Traditional/simple approaches with scrapy come back without ever having reached the site. More advanced approaches like Selenium (which mimics an actual web browser like Chrome to near-perfection) are even occasionally detected and CAPTCHA-blocked (blocked with a Turing test a computer typically can’t solve yet which is easily solvable for humans) by the site. The best I managed to do, with a Selenium-based Chrome web-driver with built in random, log-normal delays so as to approximate a human’s pace while perusing a site, was a CAPTCHA block every 15 minutes or so. There are services that will solve CAPTCHAs using mechanical Turks in Indonesia and the like, but I elected to just set a rotating 15-minute alarm and briefly interrupt my other coding work to solve a CAPTCHA myself so the scraping could continue.


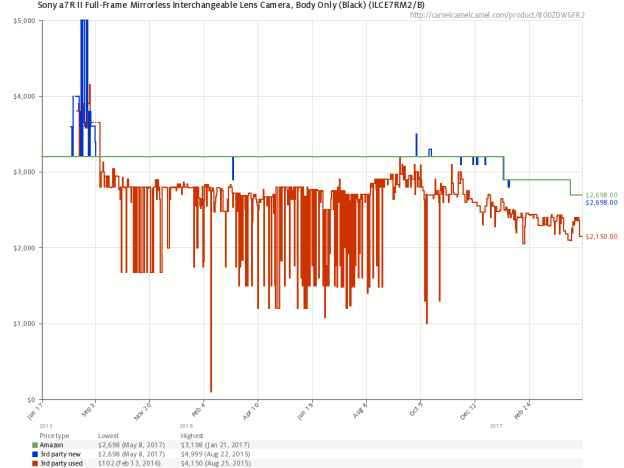
The text data I collected from the site included textual classifications of the product as well as its Amazon ID, title, and the highest and lowest prices it had achieved during the past year. Conveniently, those two price points allowed me to calibrate the y-axis of the price history graph image. I designed a method that would find the boundaries of the graph panel within the image, trace up the right-hand border pixel-by-pixel until it found the colored price line, and then trace that line from right to left across the image, jumping over gaps in price coverage as necessary. It did this separately for Amazon-sold items, third party new items, and third party used items (each had a different color in the graph). I wrote a function to edit the URL such that the graph image would display to an arbitrarily large size (an oversight, perhaps, by the folks at CamelCamelCamel), allowing me to achieve greater precision in my calibrations and obtain uniformly-sized graph images for each product.


Example Graph (Amazon in green, 3rd party new in blue, 3rd party used in red):

Amazon example.png


As I do not have access to the actual raw data, I have no way of performing conclusive error analysis, though I’ve recreated the graphs from the scraped price data and found that they overlap very consistently. As the maximum price and minimum price were used to calibrate the image, their error was expectedly quite low (within a rounding error). However, I was able to compare the most recent price in the scraped data to the most recent price visually imprinted in the graph image and found that they were within a dollar of each other for items costing a few hundred dollars (~0.5%), which should be sufficiently low for informative analysis.


Example 3rd party used graph vs scraped results re-graphed:

This slideshow requires JavaScript.


Findings:

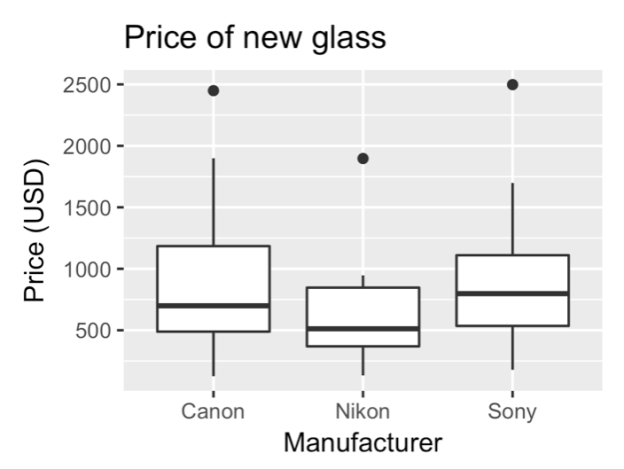
As a photography enthusiast, I couldn’t help but investigate one of the age-old questions in the photography community: Canon vs Nikon. Additionally, as a fan of Sony’s new Alpha series cameras (including the A7RII/III mirrorless line), I threw in Sony for comparison. How do prices and price volatility compare between these three large camera brands?


Amazon analysis price.png

Sony has more expensive lenses on average, having made large strides into the mirrorless market recently.


Amazon analysis price drop 4 months.png

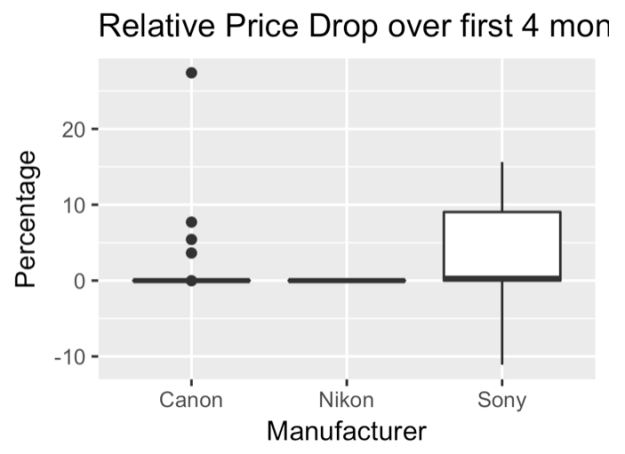
However, Sony has been expanding into the mirrorless market at a very aggressive pace, releasing more cameras in a year or two than Canon or Nikon may in a decade. Perhaps as a result of this, Sony’s cameras show a much faster price drop over the first four months than both Canon and Nikon cameras.


Amazon analysis mode - mean.png

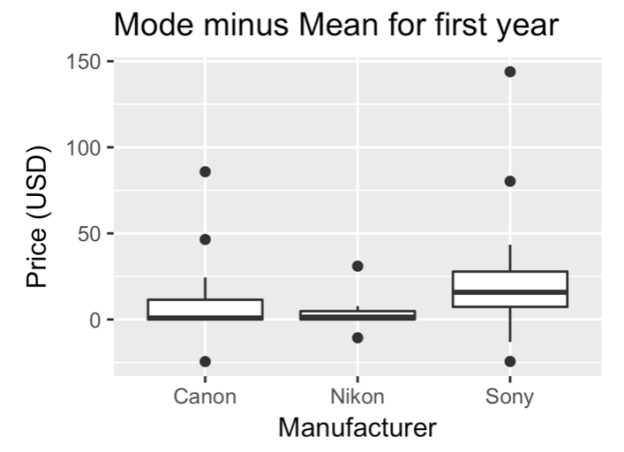
I tried to measure “flash sales” (i.e. sales that exist only for a very short period of time) using the mean price (which will be skewed by extreme values) subtracted from the mode price (which represents the “sitting” or standard/normal price of the items), and I found that Nikon has relatively stable prices (and Sony’s as expected, are the most volatile).


This slideshow requires JavaScript.

Sony’s prices also had a larger standard deviation within the third-party new and Amazon-sold categories, consistent with company sales. Canon’s prices showed a larger standard deviation in the third-party used market, perhaps showing that Canon users have a more active used gear market (which matches with personal anecdotal observations, for what it’s worth).


Although more analysis could easily be done, the point of such efforts is as a proof of concept that creative approaches to web scraping can yield data that are otherwise unaccessible.

All About the Digits: Approaches to the Canonical MNIST Dataset

Links to code on Github: mnist_utils.py and mnist_features.py


Executive Summary:

I’ve created a set of functions that can pre-identify some features in the MNIST data set that one would normally imagine a first or second hidden layer handling. Mainly, it can identify (with some limited success) distinct straight line segments. Further steps will include feeding this information into a neural network to assess whether it improves classification accuracy or not, and improving the feature detection as well.


Motivations:

Neural networks, especially those of the convolutional or capsule variety, have an astounding ability to recognize and process images. However, they come with one major drawback: the reliance on an enormous volume of data for training. The amount of data and training they require is often a barrier to developing a competent network at a sufficiently difficult task (in terms of access to enough data or access to enough computing power). This need is beyond that of other machine learning approaches, and well beyond what seems necessary for learning in their distant biological cousins. For instance, I let you study one example of one Chinese character closely for some time (a few minutes should suffice), even with no prior knowledge of Chinese, you would be able to discern it against other Chinese characters. Furthermore, you would nearly as easily recognize it in scale- and rotationally variant forms. As deeper neural networks (which have traditionally been the direction for improving computer vision performance) explore increasingly astronomic possibility spaces (in which it’s hard to imagine converging on a workable solution), I can’t help but wonder if there are any sensible hard-coded features that are worth adding into neural networks to allow shallower neural networks (and accordingly less data and less processing) to achieve similar performance, as if by acting as a replacement solution for one or more lower layers. Such an approach would also help to make the resulting neural network systems less of a black box. Below, as an ongoing project, I’ve catalogued some explorations into possible features that may aid in classification of the MNIST handwritten digits, with the purpose of further improving my understanding of image techniques and as a means to explore neural networks.


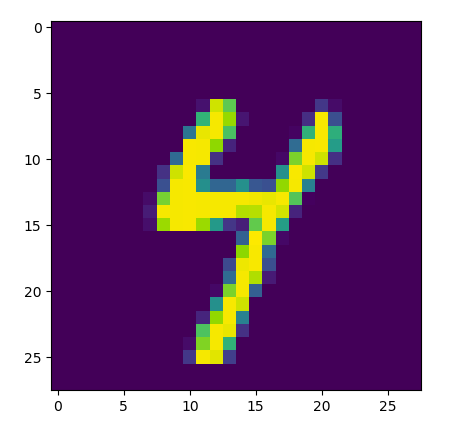
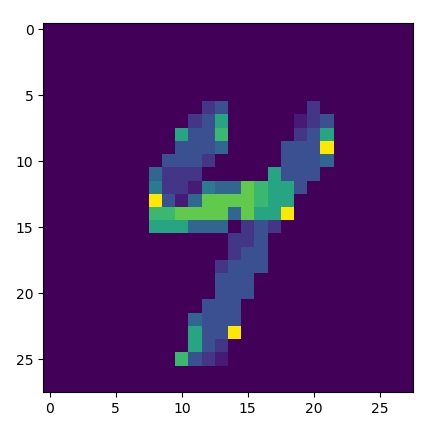
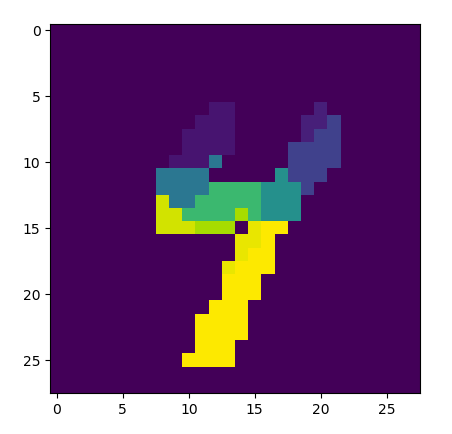
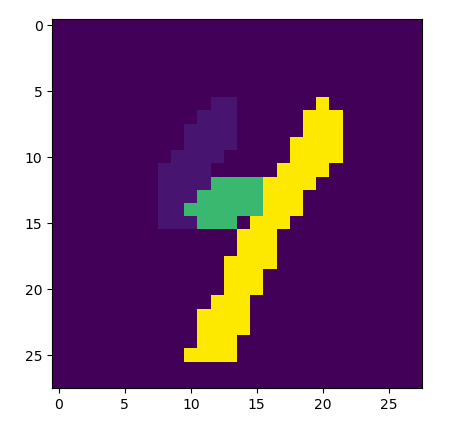
The feature detection works by calculating basic image gradients at each pixel, arbitrarily assigning a direction orthogonal to the gradient at each pixel (always a ninety-degree rotation in the same direction), clustering the pixels into discrete groups based on pixel alignment with their neighbors, and systematically flipping the polarity of their directions until optimally “laminar” flow is achieved throughout the whole system (until each pixel group is most similarly aligned with its neighbor groups). These groups, when further clustered by similarity in alignment, outline distinct line segments.


Original image:

MNIST 4-1 raw.png

Angle based on gradient direction:

MNIST 4-1 gradient.png

Clustered into small groups:

MNIST 4-1 semi-joined.png

Joined into segments:

MNIST 4-1 joined.png


Below are two examples for each digit. Results are unfortunately still inconsistent for curvy digits (0, 2, 3, 5, 6, 8, 9), though fairly consistent for straighter-line digits (1, 4, and 7).

“Fake News”: Detecting Bias on Wikipedia using NLP

Executive Summary:

My team partner (Rachel Kogan, a NYC Data Science Academy bootcamp classmate) and I filtered the Wikipedia English corpus down to bags of words using pySpark and trained machine learning models to detect bias (point of view tags) on TF-IDF data with nearly 90% accuracy.


Motivations:

The tide of news about fake news has reached a crescendo, and not many feasible solutions have been proposed for controlling the spread of biased information. The push for Facebook and other large social media sites on which most fake news seems to promulgate to manually editorialize their content is certainly infeasible for one. This problem seems ripe for machine learning approaches, specifically Natural Language Processing, so we set out to develop models that could detect bias in a large textual corpus. Due to its ease of access and pre-labeled content, we trained our models on the English Wikipedia corpus.


Wikipedia is one of the topmost visited websites in the English-speaking world and serves as a first go-to when looking for a quick overview on almost any topic. It’s surprisingly accurate and reliable given its anyone-can-edit ideology and site structure (roughly as reliable as the Encyclopedia Britannica according to a 2005 Nature study). Bots and users alike peruse the site for vandalism and other problematic edits, marking certain sentences, paragraphs, and entire articles as having a problem from a specific set of pre-defined tags. Fortunately for us, POV, or point of view (implying non-neutral point of view) is one such tag. There are several thousand articles in the English language Wikipedia with current POV tags, which provided a substantial enough body of data with which to train a bias detector. We downloaded the entire current-version (as of May 2017) English Wikipedia corpus in XML and stored it in the cloud using Amazon’s EC2 and S3 services. After separating the massive (~64GB) textual dataset into separate pages by the embedded XML page tags, we were able to filter the pages down to the usable articles (removing redirect pages, talk and other user pages, and simple list pages). The POV tags within each page’s text follow a replicable format (“{{POV … }}”), allowing for a regex-like filtering of the total articles down to just the articles with POV issues, and furthermore, articles for which the entire body of text is tagged as having POV issues (as opposed to just a paragraph or single line) also show a replicable special POV tag located in the header of the text, making filtering out articles with only very minor POV issues simple.


We then sampled from the rest of the corpus (presumably without POV issues) to generate training and test data sets with roughly equal proportions of non-neutral and relatively neutral articles. The XML markdown-style documents were then parsed with a set of regular expressions to generate a simple bag of words for each article (thereby removing all tags, including those that mark the article as having POV issues). We tokenized the bags of words and removed stop-words, followed by generating TF-IDF values for each unique term in each document (Term Frequency Inverse Document Frequency is a canonical way to calibrate simple bag of words term counts into relative term importances by adjusting by the rarity of each term across the entire corpus).


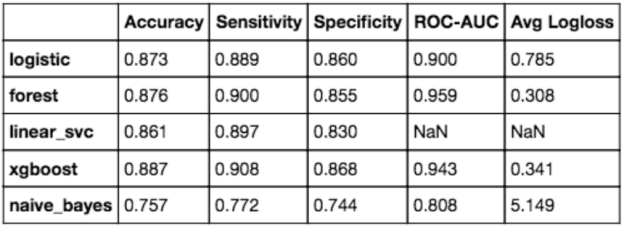
We trained many kinds of models to analyze which may be best at detecting bias in Wikipedia articles (and, by extension, in other sources of textual data as well). Among the best performers were logistic regression, random forest, and XGBoost (see metrics below).

Wikipedia model comparison.png


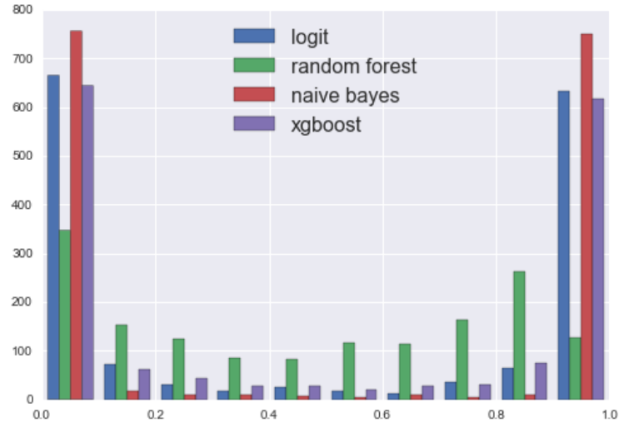
Additionally, we found that our models were fairly confident in their predictions, giving further credence to the idea that something as complicated as bias can be well handled by NLP and machine learning methods (x-axis is predicted probability, and y-axis is the number of such observations):

Wikipedia validation set predicted probabilities by model.png


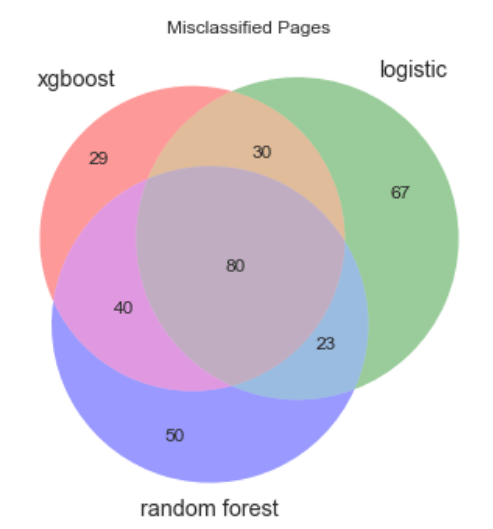
We further investigated correlations in misclassification between these models to see if an ensembled approach would significantly improve our results. However, high correlations between our models limited the extent to which we could improve our overall misclassification rate through ensembling. As you can see below, any majority-voting metric would have misclassified at nearly the same rate.

Wikipedia misclassification.png

It’s All Greek to Me: Creating My Own Regex Writer

Link to the code on Github: utils_regex.R


Executive Summary:

I developed a library of trivial but useful regex-writing functions that make normally painful expressions faster to write and easier to read. I expanded the suite of typical regex functions to include others I wished had existed all along, mostly for reducing all the boilerplate code that comes along with certain types of expressions. I like using these functions because they make writing regex faster, reading easier, and debugging much simpler.


Motivations:

Regular expressions often look like chicken scratch to programmers who didn’t write those specific expressions themselves. After working with them frequently, I find them relatively straightforward to write but still unfortunately painful to read and understand. I created this suite of functions that build up regular expressions in easy-to-understand blocks so that other programmers who look at my code (including future-me) can easily understand what and how I was getting at with these expressions.


To start, why is there no simple regex remover function? Sure, you can write re.sub with repl equal to the empty string (gsub(replacement = “”) for the R programmers), but why all the boilerplate? Also, why are the patterns always written first, when the strings it will act on (especially given R’s piper) would make more sense? Well…


rem(strings, pattern, …) is a single substitution with an empty string. grem is the gsub version of that.


If I want to remove multiple things or do multiple substitutions from/on a list/vector of strings, do I really have to chain the expressions together (re.sub(re.sub(re.sub(re.sub(to infinity and beyond!)))) until the stack overflows? Or worse yet, copy-paste nearly the same line many times in a row with a new or identical variable name each time? Nope.


grems(), subs(), gsubs(), greps(), grepls(), regexprs(), and gregexprs() (the “s” is just indicating the plural form) do exactly that, but with a built in for loop to further reduce boilerplate your eyes don’t need when you’re already looking at regex. subs() and gsubs() have the added benefit of using a single named vector in R, so “USA” = “United States” would turn “United States” into “USA”. If you’re staring with two separate vectors, just rename the patterns with the replacements.


Do you have a set/list/vector of expressions you’d all like to test simultaneously? Just wrap it inside any_of(), which will make the “(x|y|z)”-like construction for you. It’s most useful if you have multiple nested or-bars.


Does finding a word need to be as ugly as “\\bword\\b”? I’ve lost count of the number of times I or an error message has caught myself having written “\\bob\\b” when I mean “\\bbob\\b” (the word bob), for instance. word(“bob”) does that.


If you’re removing certain words, you’ll often end with hanging punctuation that’s painful to remove. Why not combine all that into one step?


Removing everything that occurs before or after (but not including) some highly repetitive set of characters can sometimes cause catastrophic backtracking and other related problems, so I’ve also created some functions that make that same process easier and faster (by providing a few better, proper lines to avoid the one-line sub you’re/I’m liable to write on a deadline) while keeping a clean, unintrusive appearance.